Demographics
Indian River County Gets Olde
One of the ways to track the demographics of a county is by comparing the median age against other counties. Below is a listing of the ten counties in the United States with the highest median age with populations of 100,000 or greater. The source for this information is the 2018 census data.
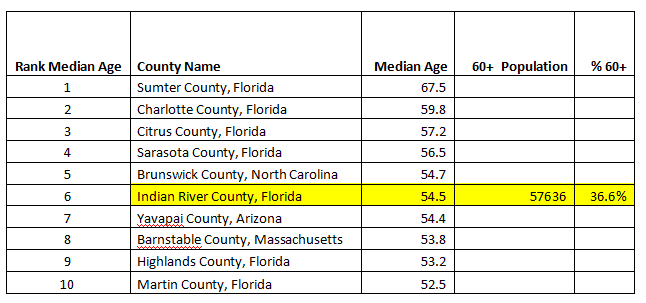
As you can see, Indian River ranks as the 6th oldest county nationally at 54.5 median age. To compare current numbers to 2010, the median age in our county in 2010 was 49.1.
Projections
We also need to look at the projected growth by age for Indian River County. The below graph shows projections by age groups for the elderly from 2010 to 2045.
The graph shows an increase in our over 55 populations to over 90,000 by 2045. This is based on two factors. Population increase in Florida and projections for people to live longer. A recent study by UCLA claims that 50% of 10-year-olds today will live to be 100! This growth rate is being referred to as the silver tsunami. Think of what this is going to mean to Indian River County in years to come. What services will this group need? What is appropriate housing for the elderly to age in place? What will be required for transportation? What will medical services need to provide? We know it is coming and this is one of the reasons the Senior Collaborative exists.
Additional Demographic Facts about Seniors in Indian River County
Information provided by U.S Census Bureau shows:
- Indian River County has a median age of 54.5 making it the 6th oldest county in United States.
- Between April 1, 2010 and July 1, 2017 the population of residents over 65 grew by 26.4% and was estimated at 30.81% of Indian River County’s population. This is in comparison to Florida which is 19.4%
- The over 65 populations in Indian River County is forecast to continue growing with a projected population of 65,000 in 2030.
- The over 65+ population has the following traits:
- 45.7% male 54.3% female
- 12.4% in labor force
- 16.1 below 150% of poverty level
- More educated (32.1% vs 27.8% USA)
- More veterans (23.3% vs 12.2% USA)
- With a disability (31.5% vs 16.7% USA)
- 14.3% are probable Alzheimer cases
- 11.56% are medically underserved
- More likely to live alone (1.48 per household vs 2.80 USA)